Trading Education · Jun 23, 2026 · 10 min read
The Multi-EMA System: A Complete EMA Strategy for CFD Trading
TradinSolutions
Trading Automation Platform
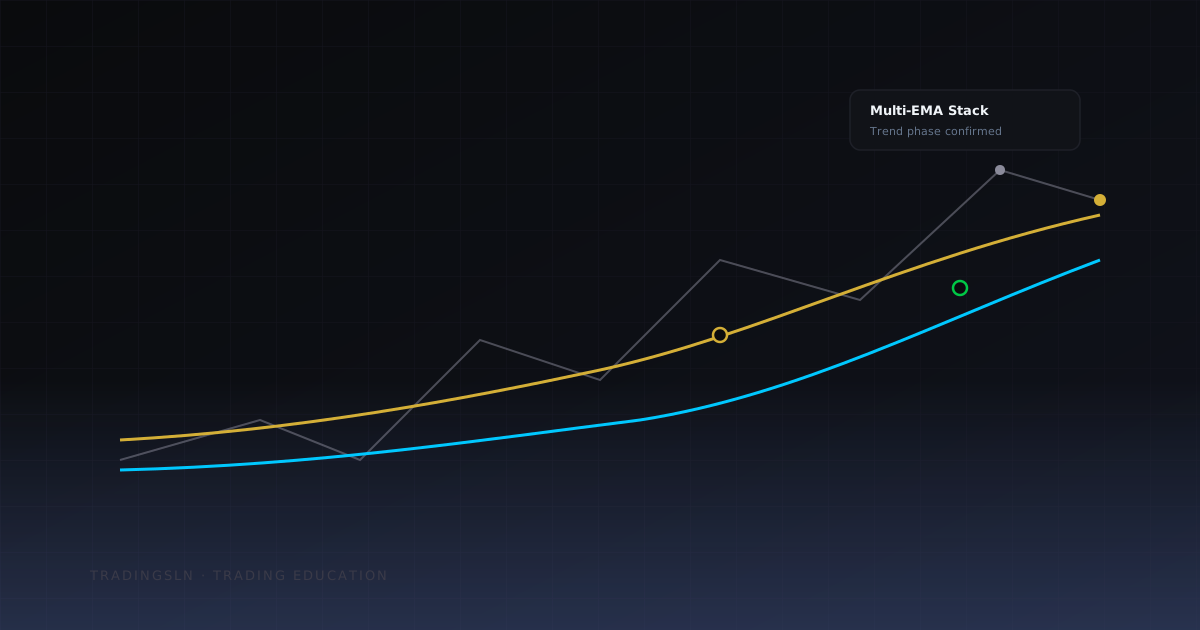
Almost every retail trader's first system is an EMA crossover: buy when the 9 crosses above the 21, sell when it crosses below. And almost every retail trader abandons it within a few months, convinced moving averages do not work. The truth is more useful than that. EMAs are excellent at describing a trend — they are just terrible at timing entries when the crossover itself is the signal. This is a complete multi EMA system for CFD trading: how to build the stack, how to read trend phase from it, where the real entries actually live, and the filters that keep the strategy out of the chop that kills every naive moving average strategy on forex, indices, and gold.
Why the EMA Crossover Strategy Disappoints
Two structural problems sink the classic ema crossover strategy, and no combination of lengths fixes either one.
Lag. An EMA is a weighted average of past closes. By the time a fast EMA crosses a slow one, the move that caused the cross has already happened. On an M15 chart of a forex major, a 9/21 cross typically prints after price has already travelled a meaningful chunk of the swing. You are systematically late, which means your stop is systematically far from any structure, which means your reward-to-risk is systematically compressed. The signal is a lagging summary of a move you missed.
Chop. Markets spend most of their time not trending. In a range, the fast and slow EMA braid around each other and a crossover system takes every whipsaw at full size. The result is the equity curve every crossover trader recognises: a slow bleed through ranging weeks, one good trend month that almost recovers it, then more bleed. The system is not wrong about trends — it is defenceless against everything that is not a trend.
The fix is not a better pair of lengths. The fix is to stop extracting an entry signal from the cross and start extracting context from the whole EMA structure. That is what a multi EMA system does.
Building the Multi-EMA Stack
Instead of two EMAs, plot three groups — a fast band, a medium band, and a slow band. A layout that works well on CFDs:
- Fast band: 5, 8, 13 — tracks the momentum of the current swing. This is the first thing to bend when a pullback starts.
- Medium band: 21, 34, 55 — the dynamic value area of the trend. In a healthy trend, pullbacks terminate inside this zone. Your entries live here.
- Slow band: 100, 200 — the regime filter. Which side of this band price trades on, and its slope, defines your directional bias.
The exact lengths matter far less than the layering. Traders have run variations of this idea for decades — Daryl Guppy's GMMA is the best-known ancestor — and 6, 8, or 10 EMAs all work. What matters is that you can read three things at a glance: order (are the bands stacked fast over medium over slow for longs, or fully inverted for shorts?), spacing (are they fanned apart or crushed together?), and slope (are they pointing somewhere or drifting flat?).
Plotting ten EMAs by hand on MT4 or MT5 is tedious, so use a single multi-EMA indicator. The free SMC Multi EMA TrendLines indicator on the MQL5 market — also linked from the TradinSolutions free indicators section — draws up to 10 EMAs from one instance and fires alerts both on EMA crossovers and on price interacting with any line, which is exactly the event this system trades.
Reading Trend Phase: Expansion, Pullback, Compression
The stack turns any chart into one of three states. Everything else in this strategy follows from correctly naming the state in front of you.
Expansion. All bands in order, spacing widening, slopes aligned. The trend is being paid for by real flow. This is the only phase in which you are allowed to be hunting entries.
Pullback. The fast band curls back and sinks into the medium band while the slow band keeps its order and slope. The front of the stack is disturbed; the back is intact. This is not a reversal signal — it is the market putting the trend on sale. Entries come from this phase resolving back into expansion.
Compression. Bands converge, braid, and flatten. Spacing collapses. The stack carries no directional information, and every crossover that prints inside compression is noise. This phase is where crossover traders donate money, and where your only job is to wait for the stack to re-order.
TIP
Make compression objective instead of eyeballing it: if the gap between your 8 EMA and your 55 EMA is smaller than one
ATR(14), treat the market as compressed and stand aside until the stack re-orders and fans out again.
The Entry Model: Trade Pullbacks to the Band, Not Crossovers
Here is the complete entry sequence. Notice that no step says enter on the crossover.
- 1Confirm alignment on the bias timeframe. The full stack is ordered and expanded on H4 (or H1 for faster styles), and price is on the trend side of the 100/200 band.
- 2Wait for the pullback into the medium band. Price must trade back into the 21-55 zone. A pullback that only touches the fast band is usually too shallow to offer a stop with structure behind it; one that slices through the slow band is not a pullback, it is a phase change.
- 3Demand a reaction. Inside the band you want evidence that buyers or sellers actually showed up: a strong rejection candle, or — cleaner — a break of the pullback's own internal structure on M15.
- 4Enter on the break, not the touch. The touch of the band is where you start paying attention. The M15 structure break in the trend direction is where you enter.
- 5Stop beyond the far side of the band or beyond the pullback swing point, whichever is farther, plus a small ATR buffer. Never park the stop inside the band you just bought.
Entering at the medium band means you are buying the trend at a discount instead of chasing its breakout, so a 2:1 reward-to-risk to the prior swing high is routinely available — the exact thing the late crossover entry structurally cannot give you.
There is one legitimate use for a crossover in this system: re-alignment. When the 8 crosses back above the 21 after a pullback inside an otherwise intact bullish stack, that cross is a confirmation trigger for a trade you already wanted. A crossover inside an established trend is information; a crossover out of compression is a coin flip.
// Multi-EMA stack — MT4/MT5 template
FastBand    = 5, 8, 13         // swing momentum
MediumBand  = 21, 34, 55       // pullback zone — entries live here
SlowBand    = 100, 200         // regime filter
BiasTF      = H4               // stack must be ordered + expanded
SignalTF    = H1               // watch pullback into medium band
EntryTF     = M15              // enter on break of pullback structure
StopBuffer  = 1.0 x ATR(14)    // beyond band or swing, whichever farther
MinRR       = 2.0              // skip anything that cannot reach 2:1
Timeframe Pairing: H4 Bias, H1 Signal, M15 Execution
A multi EMA system works on any timeframe, which is exactly why most people misuse it — they read bias and execute on the same chart. Split the jobs.
H4 sets the regime. Once or twice a day, check whether the stack is ordered, expanded, and sloped, and which side of the 200 EMA price holds. That read stays valid for hours. If H4 is compressed, you are done for the day on that instrument.
H1 tracks the pullback. With H4 aligned, watch H1 for price rotating back into the medium band. This is the setup-forming state — and the point where an alert on band interaction earns its keep, because you do not need to stare at the chart until price is actually in the zone.
M15 executes. Inside the H1 medium band, drop to M15 and wait for the pullback's internal sequence of lower highs (in an uptrend) to break upward. That break is the entry; the M15 swing low inside the band anchors the stop.
The ratio between the timeframes is roughly 4x at each step, which keeps each chart genuinely distinct. Swing traders can shift the whole structure up to D1/H4/H1 without changing a single rule.
WARNING
Never take an M15 entry against an expanded H4 stack. Counter-trend scalps against an aligned stack occasionally win and always teach the wrong lesson — the losses that follow give back weeks of pullback-entry gains.
Where EMAs Fail — and the Filters That Save the System
Every moving average strategy for CFD and forex trading fails the same three ways. Build the filters in from day one instead of discovering them with your account.
Higher-timeframe ranges. An H1 stack can be beautifully aligned while price is simply rotating from the bottom of a D1 range to the top of it. The pullback entry then triggers directly beneath the range high — the worst location on the chart. Before taking any signal, check where price sits relative to the last D1 swing high and low. Structure outranks the stack: an aligned stack running into a major higher-timeframe level is an exit environment, not an entry environment.
News spikes. A CPI or FOMC candle slices through all ten EMAs in one bar. The stack then takes hours to re-form, and every signal printed in the interim is noise built on a broken average. The rule is mechanical: no new entries in the 30 minutes before a high-impact release on the instrument's currency, and none afterwards until the stack has visibly re-ordered. The AI economic calendar built into TradinSolutions flags these windows, so the check takes seconds.
Thin sessions. On EURUSD, GBPUSD, and index CFDs, an M15 touch of the medium band during the Asian session usually has no flow behind it — spreads are proportionally wider and the pullback is just drift. Restrict M15 executions to London and New York hours. Gold traders should be strictest of all: XAUUSD band interactions during the London open and the New York overlap carry real institutional participation; the same touch at 03:00 server time is noise.
Risk Rules Per Entry
The entry model gives you location. These rules decide whether you survive the weeks when the market gives nothing.
- Risk 0.5-1% per trade, fixed fractional. On a prop account with a 5% daily loss cap, stay at 0.5% — three losers plus spread costs at 1% each puts you uncomfortably close to the line.
- One position per instrument per pullback. No averaging down inside the band. If the first entry stops out, the phase read was wrong; re-entry requires a fresh pullback sequence.
- Breakeven on structure, not on pips. Move the stop to entry only after price prints a new swing high or low in the trend direction. Arbitrary plus-ten-pips breakeven rules convert winners into scratches in exactly the trends this system is built to ride.
- Trail runners behind the medium band. The 34 EMA on the signal timeframe makes a natural trailing reference — exit on a close through it, not a wick.
- Two consecutive losses on one instrument means stand down for the session. The stack is telling you your phase read is off; more entries will not fix your eyes.
Tag every trade with the phase you read at entry — expansion, pullback, or compression. Run 30 trades through the free trading journal on TradinSolutions and the pattern is nearly always the same: the losers cluster in compression-phase trades you talked yourself into. The data fixes discipline faster than willpower does.
The multi-EMA stack does not predict anything, and it does not need to. It classifies the market into expansion, pullback, and compression, restricts you to buying pullbacks inside aligned expansion, and hands the chop — the thing that kills every ema strategy built on crossovers — to someone else. Install the free SMC Multi EMA TrendLines indicator, set band-interaction alerts on your two or three main instruments, and paper trade the sequence for two weeks before risking a euro. And if you want the full build-out with chart-by-chart examples, the EMA Strategy course on the TradinSolutions platform walks through every phase, filter, and management rule in this article at trade level.
Related posts
Copier Automation
Master-Slave Copying Explained: The Failure Modes Every Multi-Account Trader Should Know
Trading Education
What Should Never Be Automated: The Boundaries Between a Trading System and a Trading Decision
Platform Tutorials